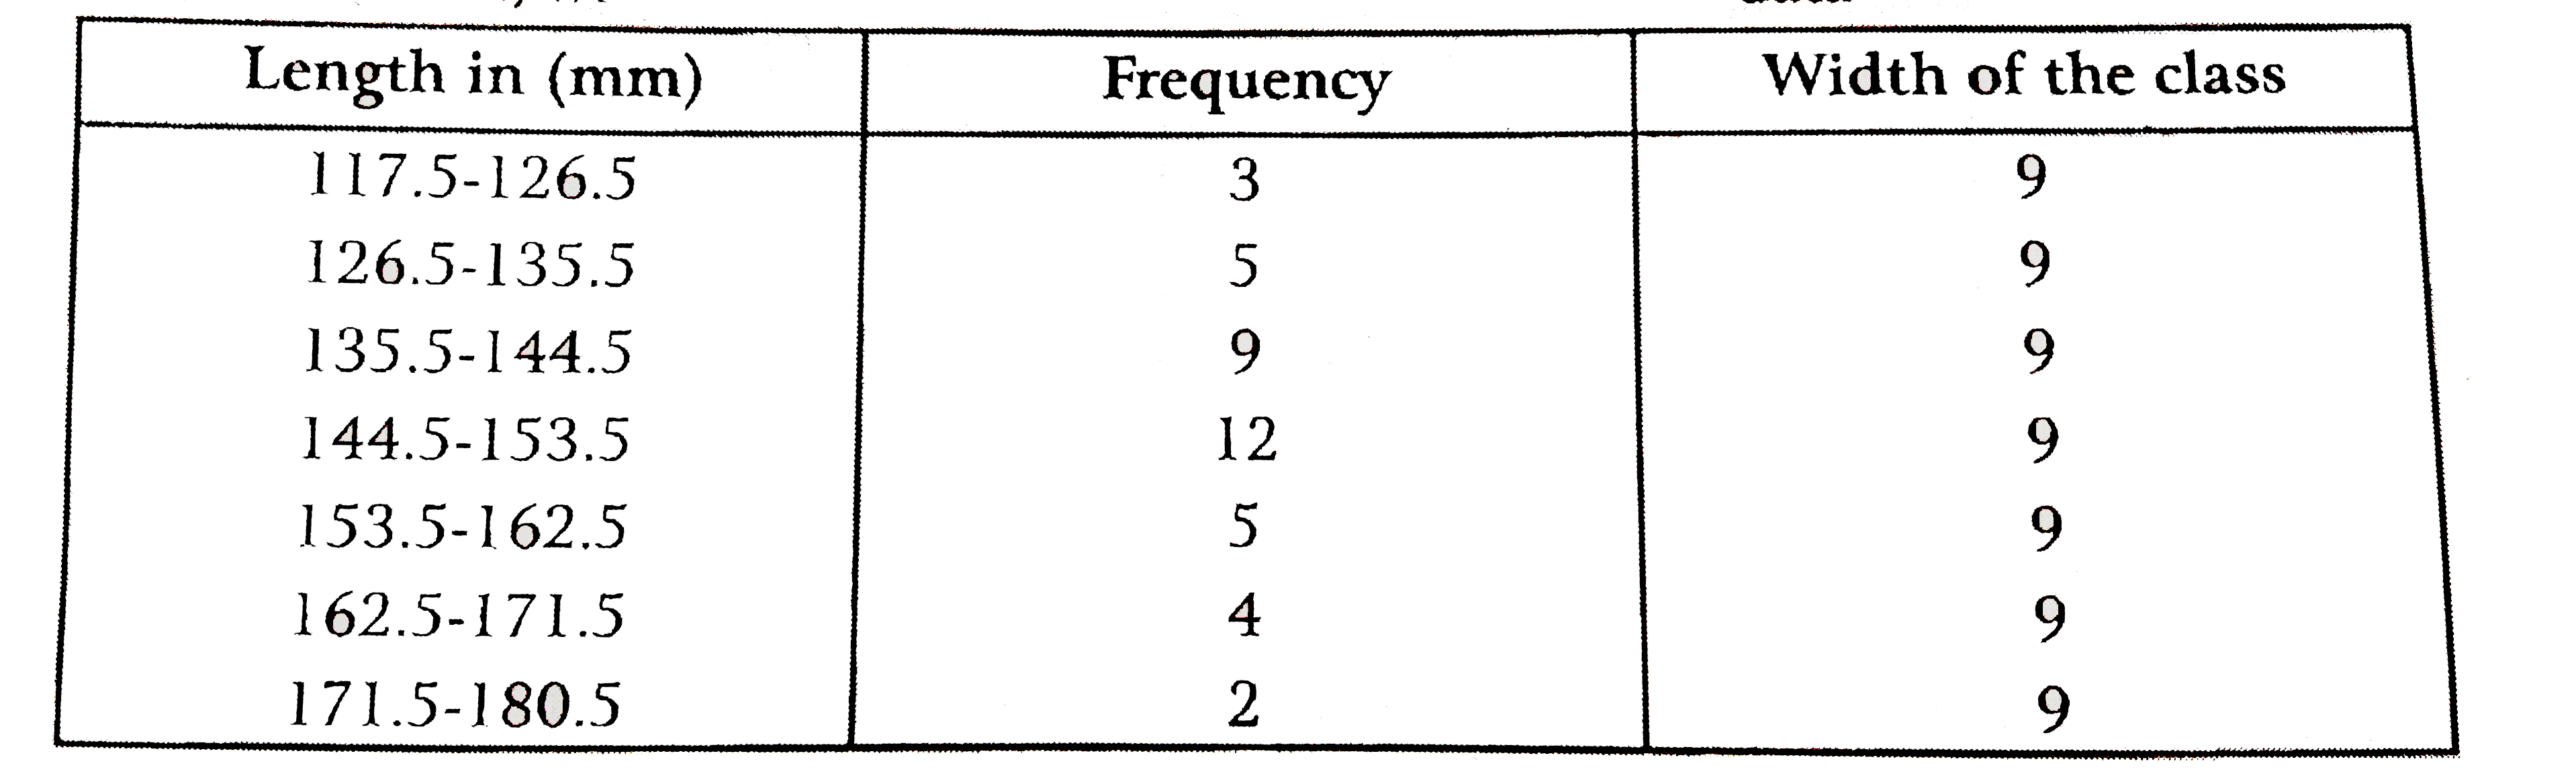
(i) We know that, the areas of the rectangles are proportional to the frequencies in a histogram. Now, we get the following modified table by given data
Now, we draw the histogram for given data:
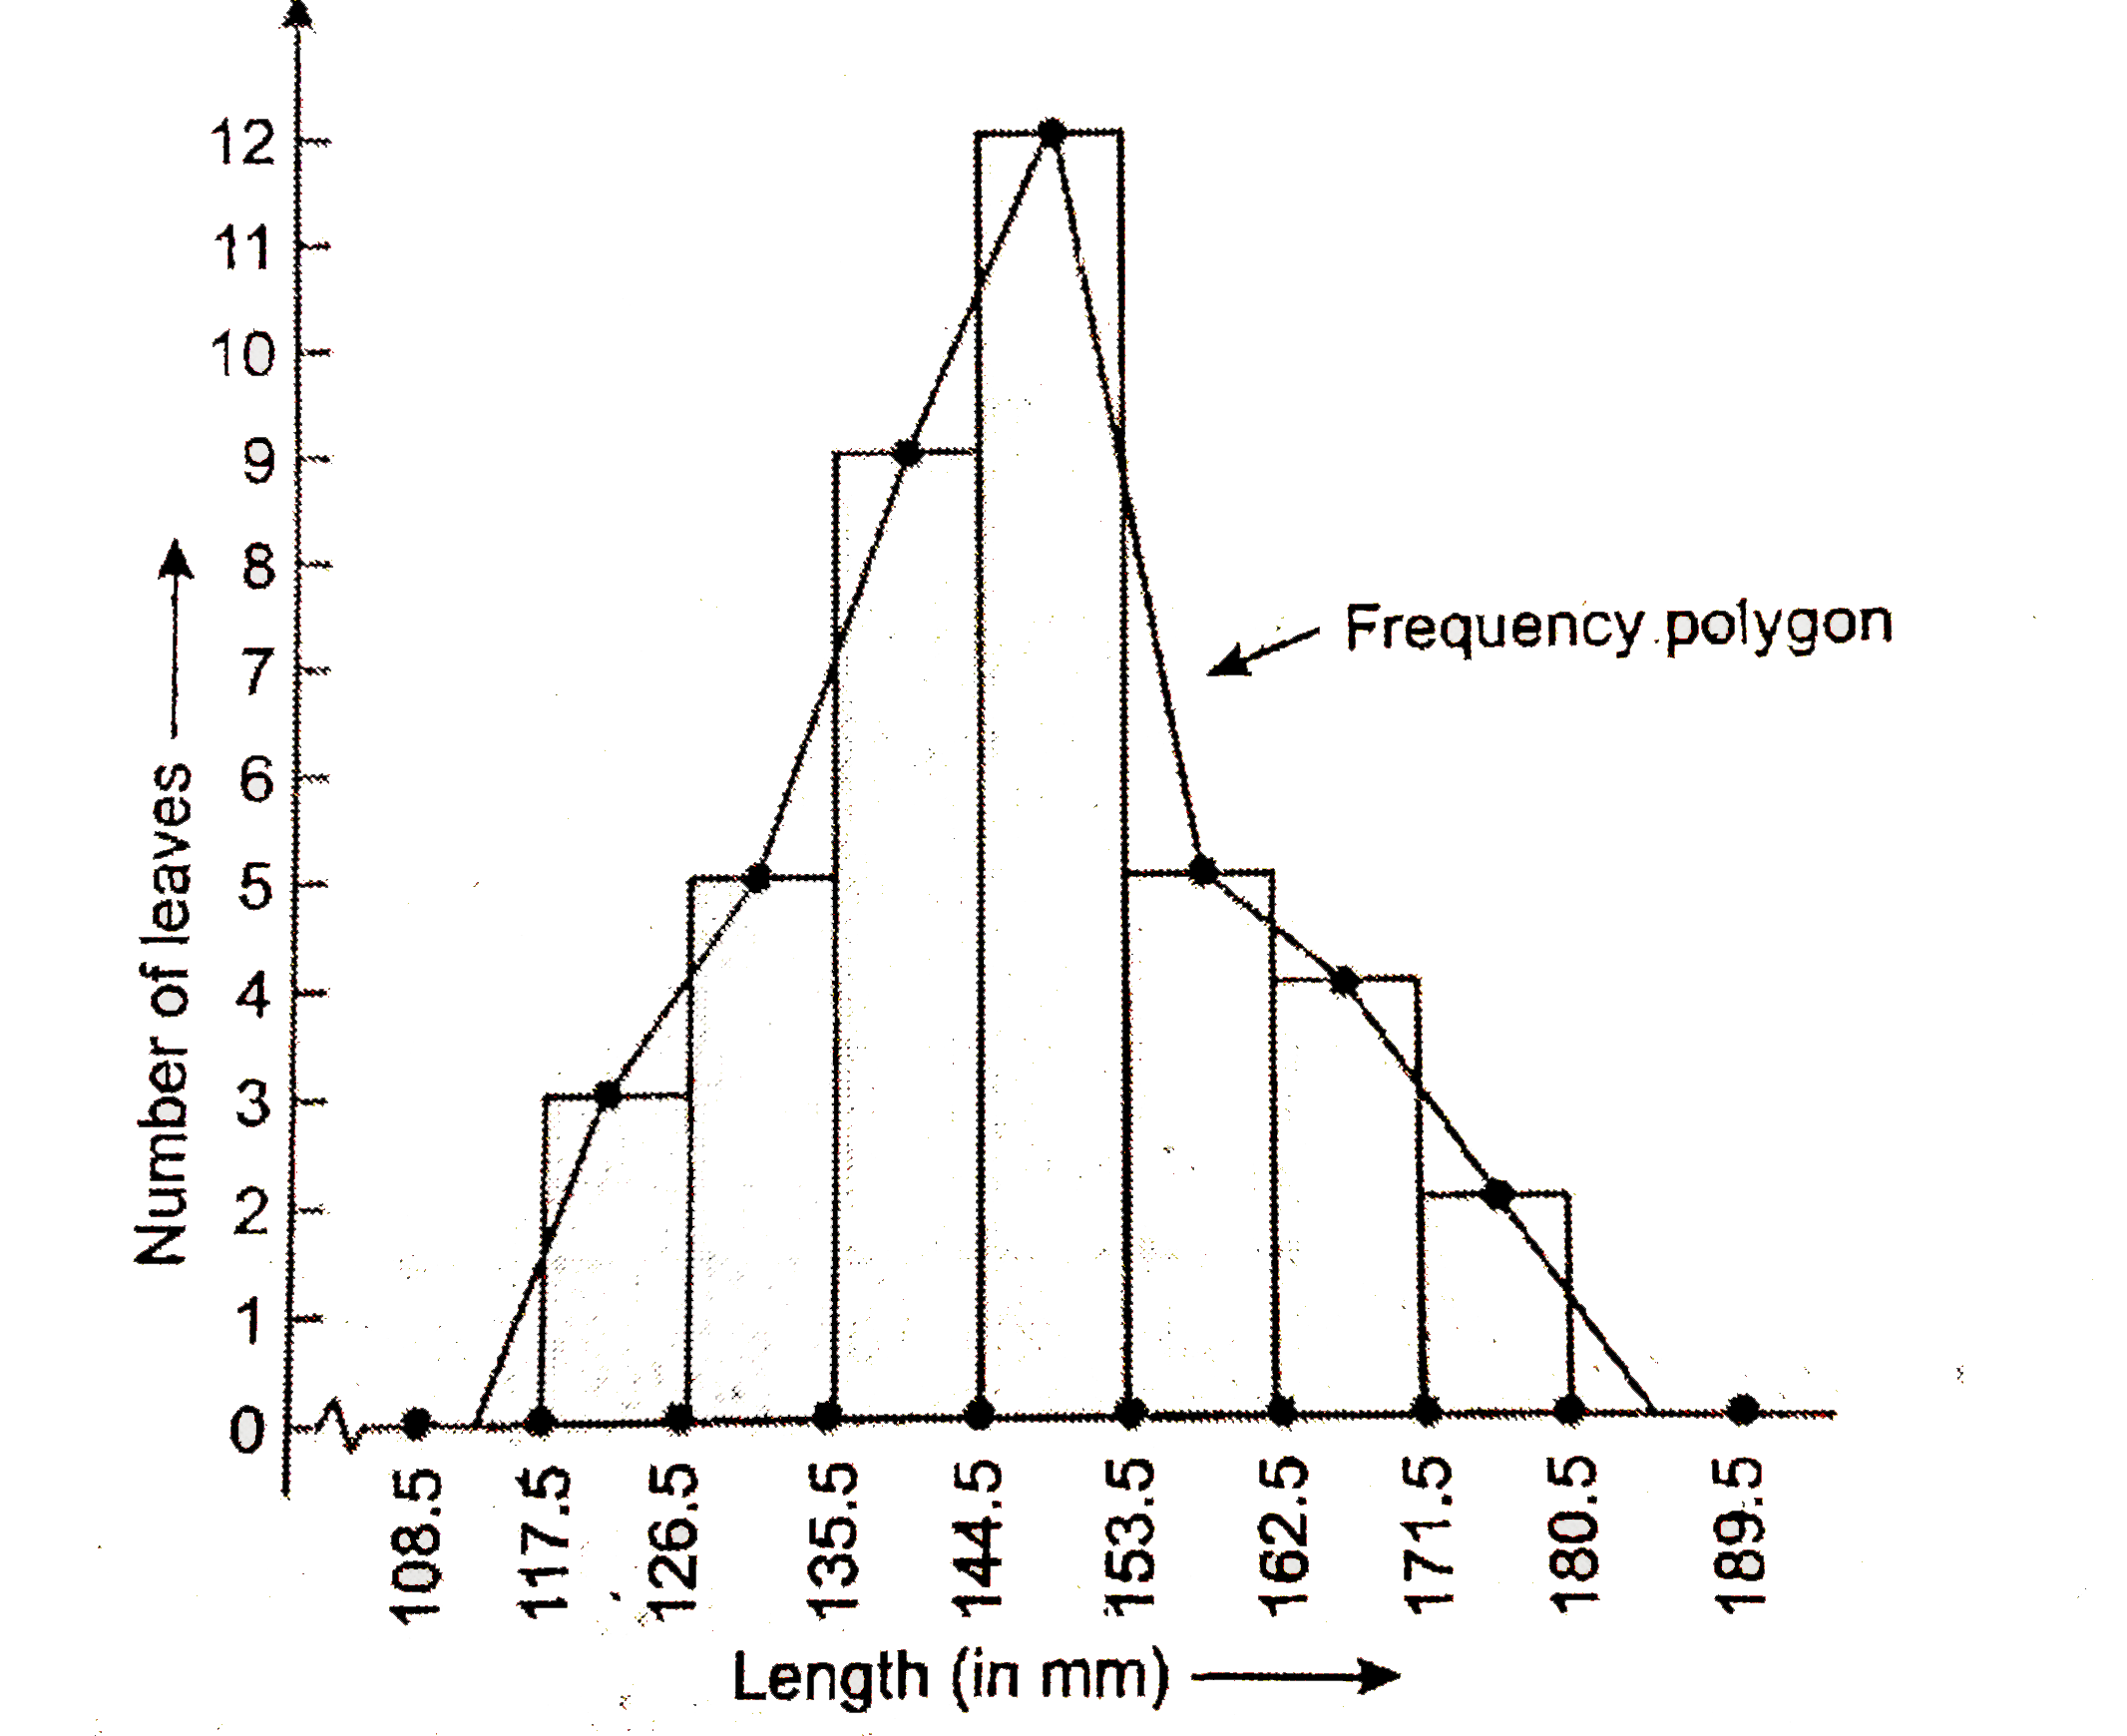
(ii) Frequency polygon.
(iii) No, because the maximum number of leaves have their lengths lying in the whole interval 145-153.


