Use app×
Join Bloom Tuition
One on One Online Tuition
JEE MAIN 2025 Foundation Course
NEET 2025 Foundation Course
CLASS 12 FOUNDATION COURSE
CLASS 10 FOUNDATION COURSE
CLASS 9 FOUNDATION COURSE
CLASS 8 FOUNDATION COURSE
0 votes
198 views
in Statistics by (88.7k points)
closed by
Construct a frequency polygon for the following data:
`{:("Class Interval",5-10,11-16,17-22,23-28,29-34,"Total"),("Frequency",7,13,8,12,10,50):}`

1 Answer

0 votes
by (97.2k points)
selected by
 
Best answer
Here, the class intervals are discontinuous. Hence, first we convert the class intervals to continuous class intervals and then find mid-points of each class interval. We do this by adding 0.5 to each upper limit and subtracting 0.5 from each lower limit.
`{:("Class Interval","Exclusive","Mid-value of Class","Frequency"),(" "5-10,4.5-10.5," "7.5," "7),(" "11-16,10.5-16.5," "13.5," "13),(" "17-22,16.5-22.5," "19.5," "8),(" "23-28,22.5-28.5," "25.5," "12),(" "29-34,28.5-34.5," "31.5," "10):}`
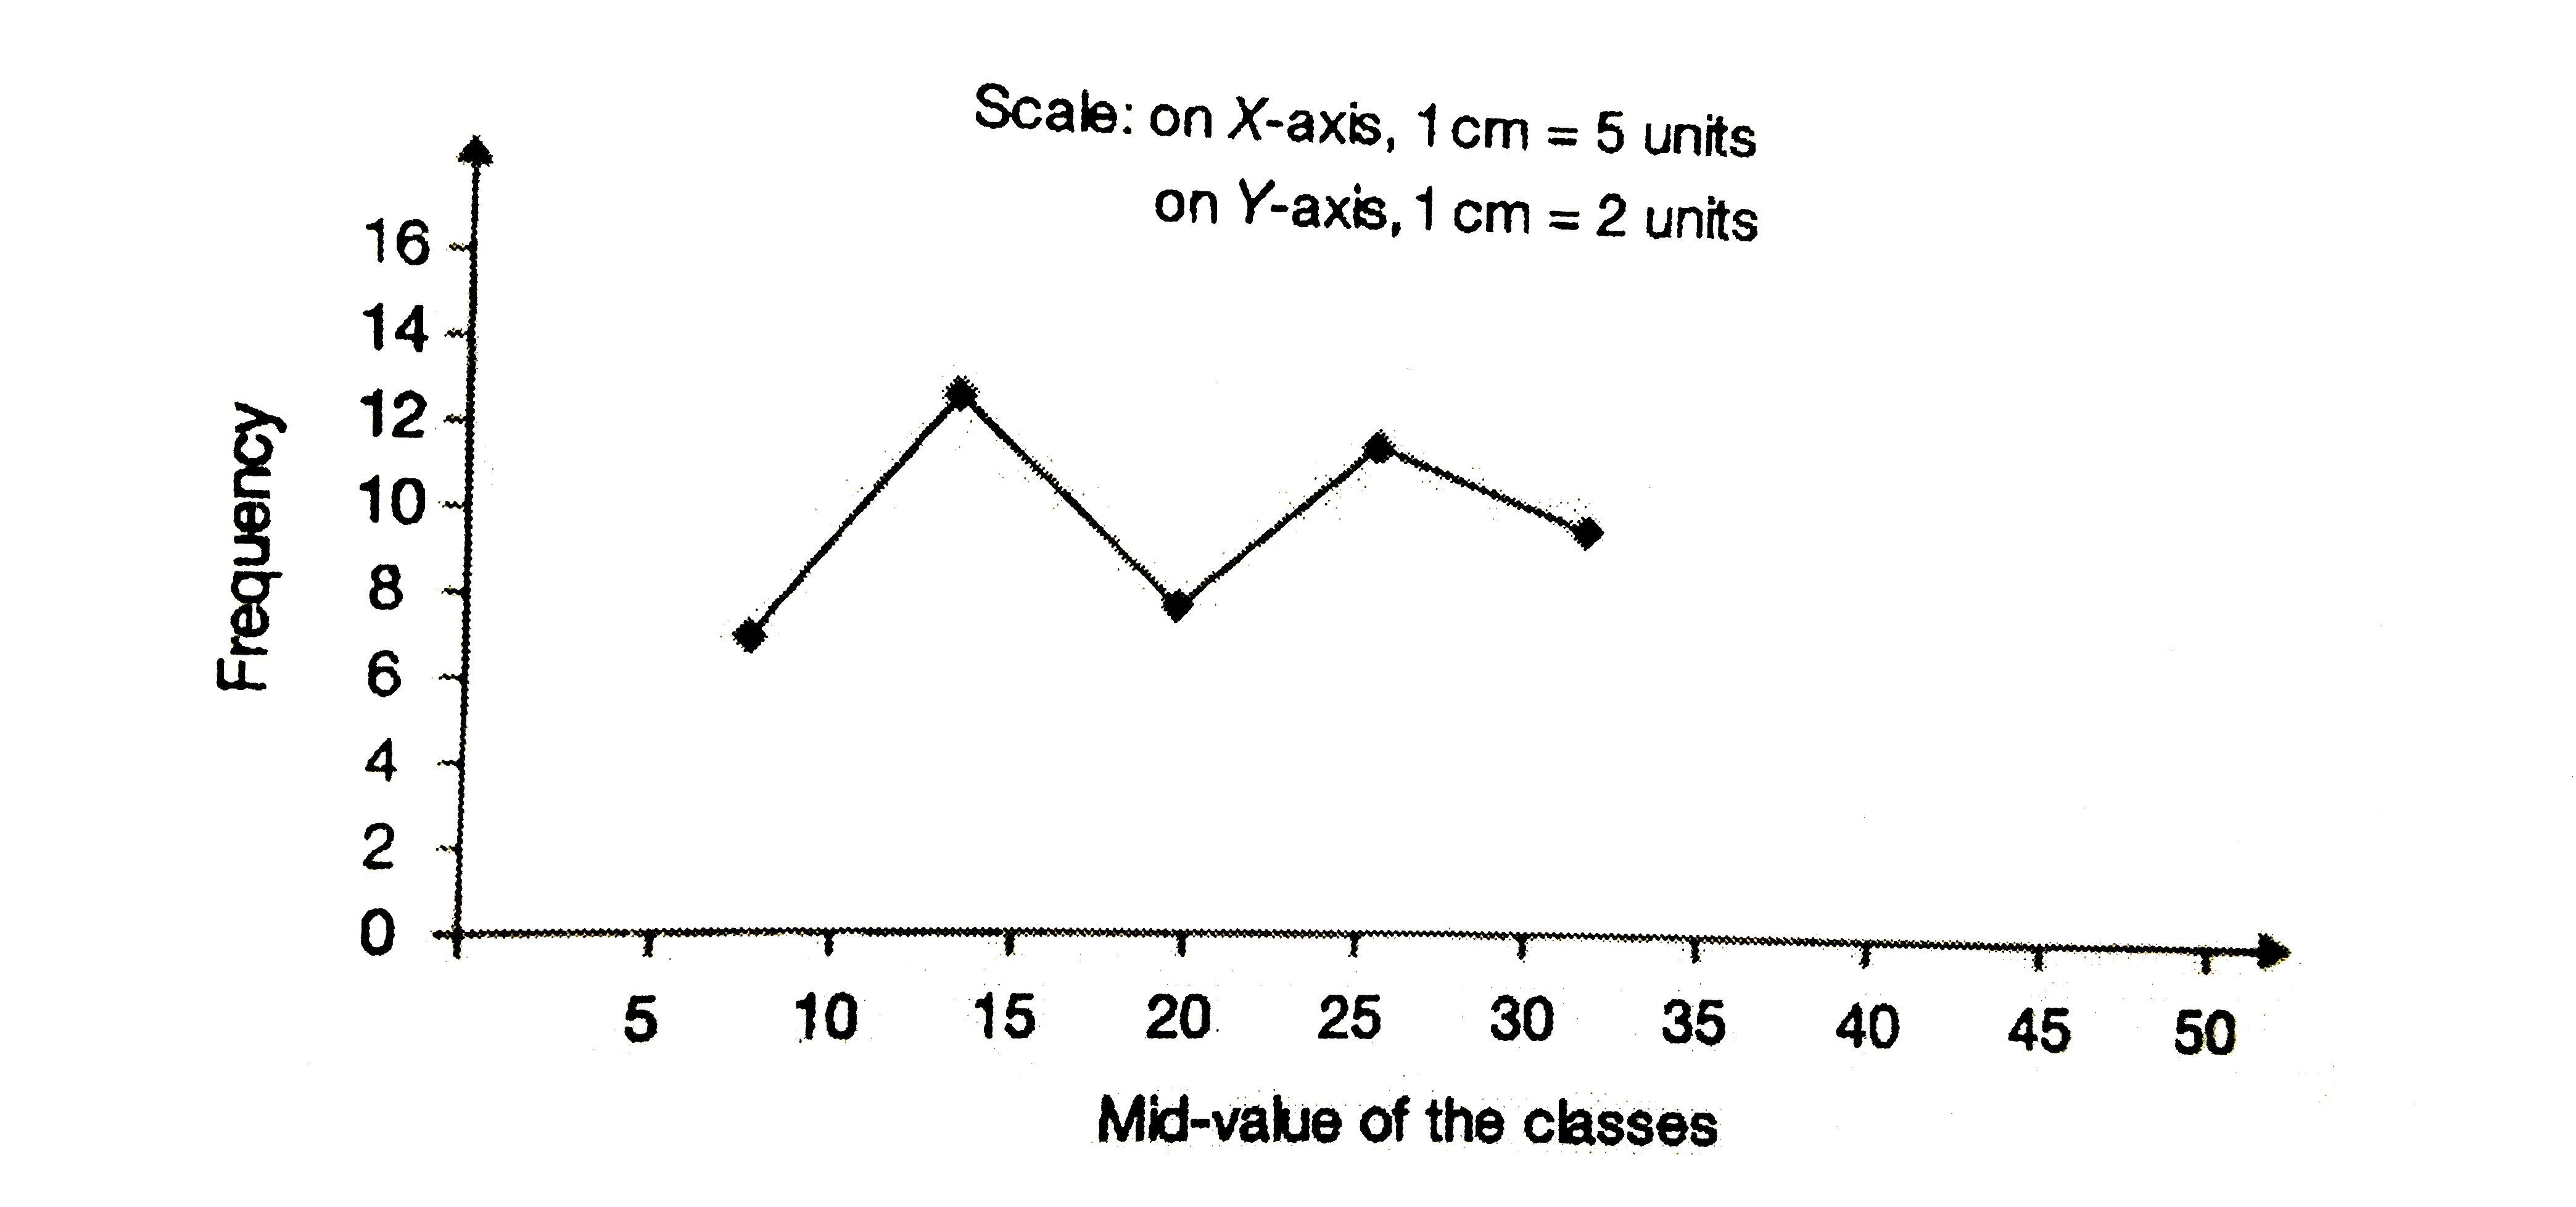
Now, taking the mid-values of class intervals on the X-axis and the corresponding frequencies on the Y-axis, we draw a frequency polygon as shown in the Fig. 9.3.
image

Welcome to Sarthaks eConnect: A unique platform where students can interact with teachers/experts/students to get solutions to their queries. Students (upto class 10+2) preparing for All Government Exams, CBSE Board Exam, ICSE Board Exam, State Board Exam, JEE (Mains+Advance) and NEET can ask questions from any subject and get quick answers by subject teachers/ experts/mentors/students.

Categories

...