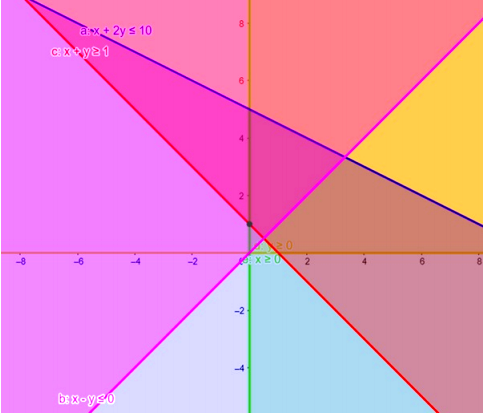
The graphical representation of x + 2y ≤ 10, x + y ≥ 1, x – y ≤ 0, x ≥ 0, y ≥ 0 is given by common region in the figure below.
x + 2y ≤ 10 ..... (1)
x + y ≥ 1 ..... (2)
y ≥ 0 ...... (3)
y ≥ 0 ...... (4)
x – y ≤ 0 ...... (5)
Inequality (1) represents the region below line x + 2y = 10 (including the line x + 2y = 10).
Inequality (2) represents the region above line x + y = 11 (including the line x + y = 11).
Inequality (3) represents the region in front of line x = 0(including the line x = 0).
Inequality (4) represents the region above line y = 0 (including the line y = 0).
Inequality (5) represents the region above line x - y = 0 (including the line x - y = 0).
Therefore, every point in the common shaded region including the points on the respective lines represents the solution for the given inequalities.
This can be represented as follows,