Let y = f(x) or, y = x2 - 4x.
The values of y for variable value of x are listed in the following table :
| x |
-3 |
-2 |
-1 |
0 |
1 |
2 |
3 |
| y=x3-4x |
-15 |
0 |
3 |
0 |
-3 |
0 |
15 |
Thus, the curve y = x3 - 4x passes through the points (-3, -15), (-2, 0), (-1, 3), (0 ,0), (1, -3), (2, 0), (3, 15), (4,48) etc. Plotting these points on a graph paper and drawing a free hand smooth curve through these points, we obtain the graph of the given polynomial as shown figure.
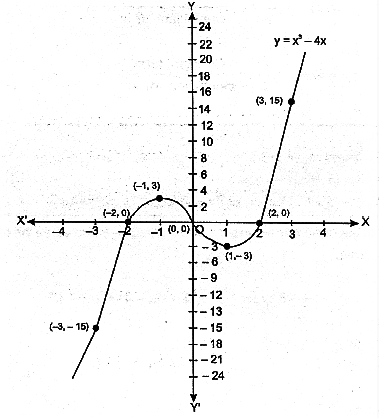
Observations :
For the graphs of the polynomial f(x) = x3 - 4x, following observations are as follows :-
(i) The polynomial f(x) = x3 - 4x = x(x2 - 4) = x(x - 2) (x + 2) is factorizable into three distinct linear factors. The curve y = f(x) also cuts X-axis at three distinct points.
(ii) We have, f(x) = x (x - 2) (x + 2) Therefore 0, 2 and -2 are three zeros of f(x). The curve y = f(x) cuts X-axis at three points O (0, 0), P(2, 0) and Q (-2, 0).


