(i) Using the given data, frequency distribution table is as given below:
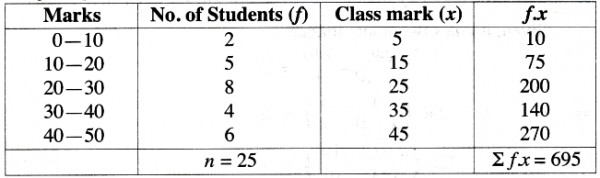
(ii) To Calculate Mean : Construct expanded table with class mark and f x as given above.

(iii) (1) In the given histogram, inside the highest rectangle, which represents the maximum frequency (or modal class) draw two lines AC and BD diagonally from the upper corlers to C and D of adjacent rectangles.
(2) Through the point K, draw KL perpendicular to the horizontal axis.
(3) The value of point L on the horizontal axis represents the value of mode.
∴ Mode =24 and the modal class = 20 -30.


