Use app×
Join Bloom Tuition
One on One Online Tuition
JEE MAIN 2025 Foundation Course
NEET 2025 Foundation Course
CLASS 12 FOUNDATION COURSE
CLASS 10 FOUNDATION COURSE
CLASS 9 FOUNDATION COURSE
CLASS 8 FOUNDATION COURSE
0 votes
238 views
in Statistics by (36.6k points)
closed by

The following distribution gives the state-wise, teacher-student ratio in higher secondary schools of India. Find the mode and mean of this data. Interpret the two measures.

1 Answer

+1 vote
by (37.9k points)
selected by
 
Best answer

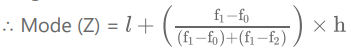
Since the maximum number of states ‘10’ lies in the class interval 30-35, this is the modal class. 

Lower boundary of the modal class, l = 30 

Frequency of the modal class, f1 = 10 

Frequency of the class preceding the modal class = f0 = 9 

Frequency of the class succeeding the modal class = f2 = 3 

Height of the class, h = 5 

a = assumed mean = 32.5; h = height of the class = 5 

∴ x = 32.5 – \(\frac{23}{35 }\) × 5 

= 32.5 – 3.28 

= 29.22 

Mean = 30.625 

Mode = 29.22 

Mode states have a students – teacher ratio 29.22 and on an average this ratio is 30.625.

Welcome to Sarthaks eConnect: A unique platform where students can interact with teachers/experts/students to get solutions to their queries. Students (upto class 10+2) preparing for All Government Exams, CBSE Board Exam, ICSE Board Exam, State Board Exam, JEE (Mains+Advance) and NEET can ask questions from any subject and get quick answers by subject teachers/ experts/mentors/students.

Categories

...