Movement along the demand curve represents a change in quantity demanded of a commodity because of a change in its price. On the other hand, shift of the demand curve represents a change in quantity demanded of a commodity because of change in factors other than price viz., change in income, change in tastes, change in the prices of related goods.
Adjoining diagram shows movement along the demand curve.

The diagram shows that when price falls from OP to OP1, demand rises from OQ to OQ1, and there is a rightward movement along the given demand curve, from point A to point B. When price rises from OP to OP2, demand falls from OQ to OQ2 and there is a leftward movement along the given demand curve. Adjoining diagram shows shift of the demand curve.
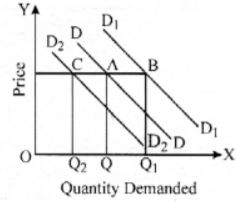
In the diagram, price is OP and the original demand is OQ. At the same price, demand rises to OQ1 the point showing OQ1 demand at OP price will be on a new demand curve which is to the right of original demand curve. At the same price, demand may fall to OQ2 which is on new demand curve D2D2.


