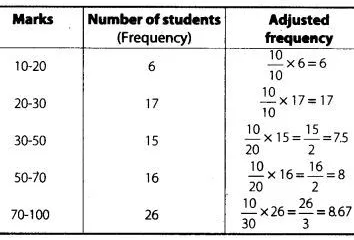
In the given frequency distribution, class sizes are different. So, we calculate the adjusted frequency for each class.
Here, minimum size = 20-10 = 10 .
We use the formula,
Adjusted frequency of a class = Minimum class size/Class size of this class x Its frequency
The modified table for frequency distribution is given by
Along the horizontal axis, we represent the class intervals marks on some suitable scale. The corresponding frequencies of number of students are represented along the vertical axis on a suitable scale.
Since, the given intervals start with 10-20. It means that, there is some break (AW) indicated near the origin to signify the graph is drawn with a scale beginning at 10.
Now, we draw rectangles with class intervals as the bases and the corresponding adjusted frequencies as heights.
A histogram of the given distribution, is given below


