Relationship among TR, AR and MR Curves: When marginal revenue is positive, total revenue rises, when MR is zero the total revenue becomes maximum. When marginal revenue becomes negative total revenue starts falling. When AR and MR both are falling, then MR falls at a faster rate than AR.
TR, AR, MR and Elasticity of demand:
1. The relationship among AR, MR and elasticity of demand (e) is stated as follows. MR = AR (e – 1/e)
2. The relationship between The AR curve and MR curve depends upon the elasticity of AR curve [AR = DD = Price]

- When price elasticity of demand is greater than one, MR is positive and TR is increasing.
- When price elasticity of demand is less than one, MR is negative and TR is decreasing.
- When price elasticity of demand is equal to one, MR is equal to Zero and TR is maximum and constant.
It is to be noted that, the output range of 1 to 5 units, the price elasticity of demand is greater than one according to total outlay method. Hence, TR is increasing and MR is positive. TR, AR, MR & Elasticity
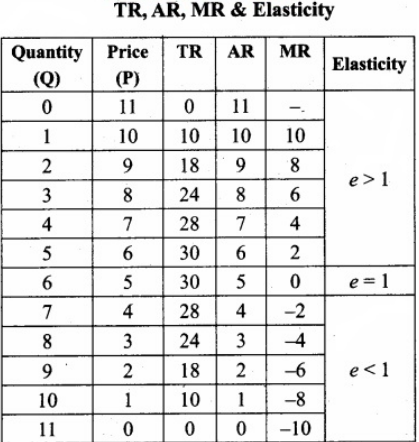
At the output range of 5 to 6 units, the price elasticity of demand is equal to one. Hence, TR is maximum and MR is equals to zero. At the output range of 6 units to 10 units, the price elasticity of demand is less than unity. Hence, TR is decreasing and MR is negative.


