Use app×
QUIZARD
QUIZARD
JEE MAIN 2026 Crash Course
NEET 2026 Crash Course
CLASS 12 FOUNDATION COURSE
CLASS 10 FOUNDATION COURSE
CLASS 9 FOUNDATION COURSE
CLASS 8 FOUNDATION COURSE
0 votes
897 views
in Chemistry by (97.1k points)
closed by
In the graph plotted between vapour pressure (V.P.) and temperature (T),
image
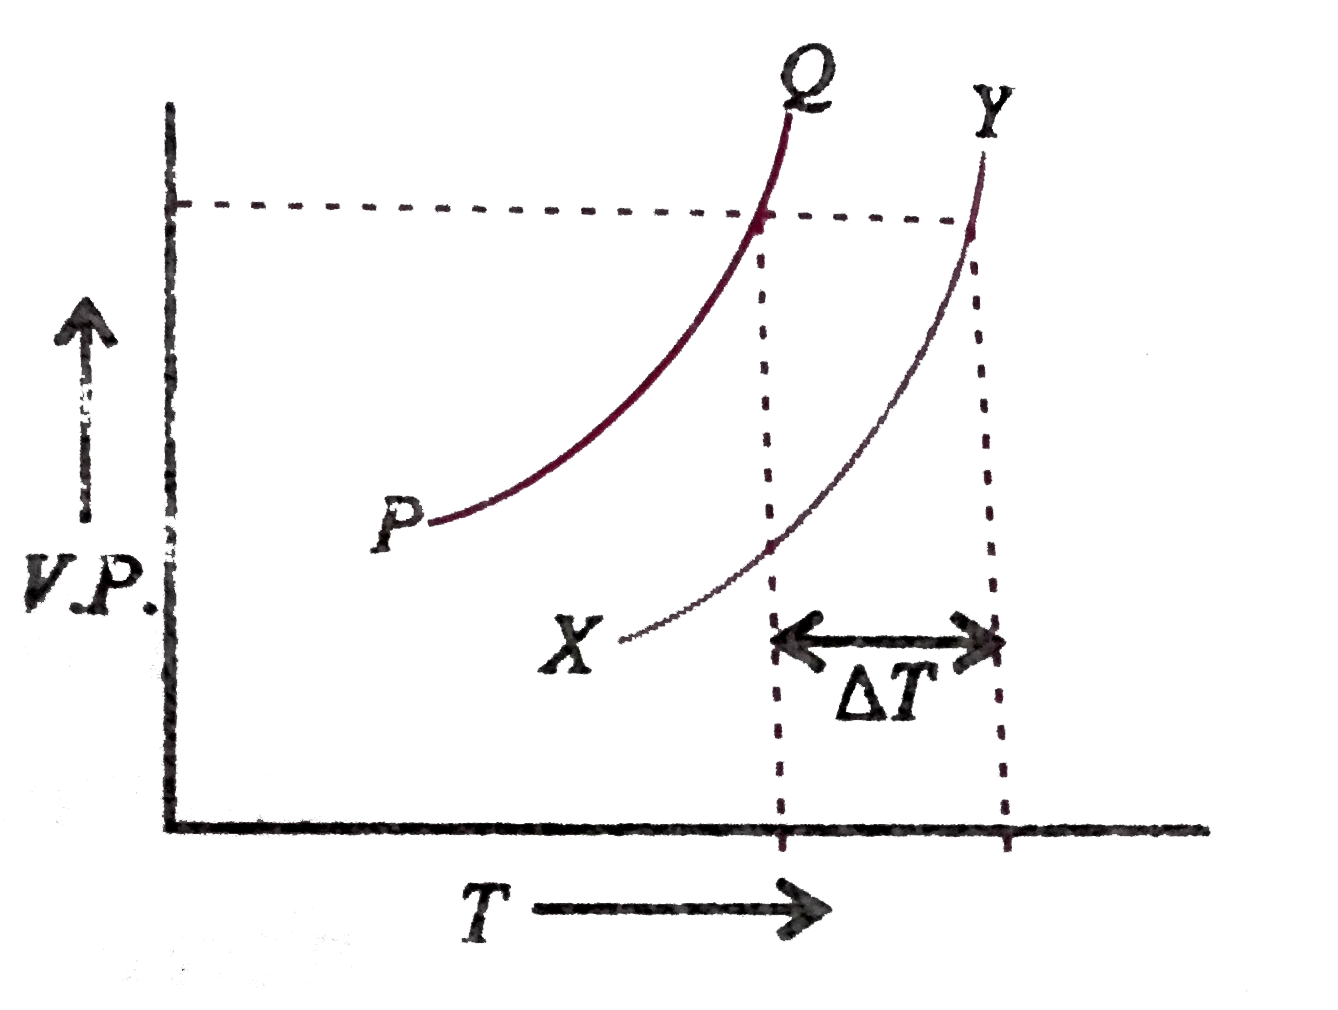
A. PQ is the curve for solvent , XY is the curve of solution and `DeltaT` is depression in freezing point
B. PQ is the curve for solution. XY is the curve for solvent and `DeltaT` is elevation is boiling point
C. PQ is the curve for solvent, XY is the curve for solution and `DeltaT` is molal elevation in boiling point
D. PQ is the curve for solvent, XY is the curve for solution and `DeltaT` is elevation in boiling point

1 Answer

0 votes
by (97.1k points)
selected by
 
Best answer
Correct Answer - D
PQ corresponds to increase in vapour pressure of solvent with temperature and XY corresponds to increase in vapour pressure of solution with temperature . `DeltaT` is the elevation in boiling point of a solution.

Welcome to Sarthaks eConnect: A unique platform where students can interact with teachers/experts/students to get solutions to their queries. Students (upto class 10+2) preparing for All Government Exams, CBSE Board Exam, ICSE Board Exam, State Board Exam, JEE (Mains+Advance) and NEET can ask questions from any subject and get quick answers by subject teachers/ experts/mentors/students.

Categories

...