The following curve is obtained when molar conductivity (Λm) is plotted against the square root of concentration, C1/2 for two electrolytes A and B :
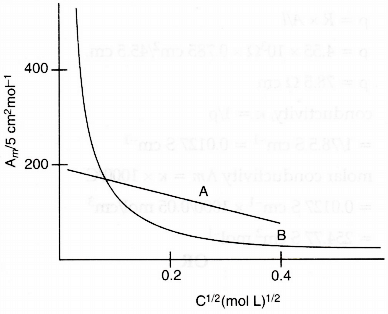
(i) How do you account for the increase in the molar conductivity of the electrolyte A on dilution ?
(ii) As seen from the graph the value of limiting molar conductivity (Λ°m) for electrolyte B cannot be obtained graphically. How can this value be obtained ?


