The rate of loss of heat dT/dt of the both’ is directly proportional to the difference of temperature (T – T0) of the body and the surroundings provided the difference in temperatures is small.
Mathematically, Newton’s law of cooling can be expressed as :

where, C is constant of proportionality. Experimental verification of Newton’s law of cooling:
1. Fill a calorimeter upto 2/3 of its capacity with a boiling water. Cover it with lid with a hole for passing the thermometer.
2. Insert the thermometer through the hole and adjust it so that the bulb of the thermometer is fully immersed in hot water.
3. Keep calorimeter vessel in constant temperature enclosure or just in open air since room temperature will not change much during the experiment.
4. Note down the temperature (T) on the thermometer at every one minute interval until the temperature of water decreases by about 25 °C.
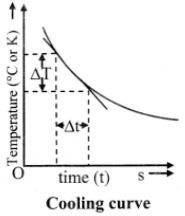
5. Plot a graph of temperature (T) on Y-axis against time (t) on X-axis. This graph is called cooling curve as shown in figure (a).

6. Draw tangents to the curve at suitable points on the curve. The slope of each tangent is \(\text{lim}_{\Delta t} \rightarrow \frac{\Delta T}{\Delta t}\) and gives the rate of fall of temperature at that temperature (T).
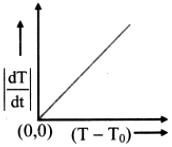
7. Now the graph of |dT/dt| on Y-axis against (T – T0) on X-axis is plotted with (0, 0) origin. The graph is straight line and passes through origin as shown in figure (b), which verities Newton’s law of cooling.

Graphical verification of Newton’s law of cooling