A great deal of information about nuclei and their stability can be obtained from the studies of binding energy. However the calculation are in general, made for atoms rather than atomic nuclei. Calculation for binding energy per nucleon has been worked out for the various atoms in the periodic table. Figure shows the plot of binding energy per nuleon against the mass number. From the graph the following sailent features are observed.
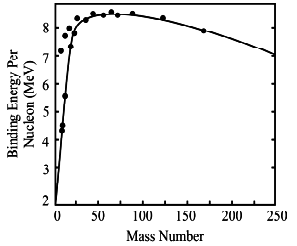
(1) As a first approximation binding energy per nucleon starts with a low value of deutron and than increases rapidly.
(2) Some nuclei like 2He4 , 6C12 and O16 have exceptionally high values as compared with their neighbours.
(3) After the rapid increase the binding energy per nucleon is found to decrease slowly as the number of nucleons increases beyond 60.
(4) The nuclei in the region of the low to middle of peridic table are most tigetly bound. For example iron cobalt, nickel belong to this catageroy.
(5) The analysis of curve shows that higher is the binding energy per nucleon, the more stable is the atom and vice versa.
The graph also gives us a very vital information. The shape of this average binding energy curve indicate that there are two general processes which can release energy from nuclei.
(a) Combining light nuclei into a more massive nucleus.
(b) Spilting up heavy nuclei of into nuclei medium mass.
This is because in both cases, the total binding energy of the products exceeds that of reactants. These two cases corresponds to phenomenon of nuclear fission and nuclear fusion.


