Use app×
QUIZARD
QUIZARD
JEE MAIN 2026 Crash Course
NEET 2026 Crash Course
CLASS 12 FOUNDATION COURSE
CLASS 10 FOUNDATION COURSE
CLASS 9 FOUNDATION COURSE
CLASS 8 FOUNDATION COURSE

1 Answer

+1 vote
by (51.9k points)
selected by
 
Best answer

We can make certain other changes to plots by passing various parameters to the plot() function. we plot temperatures day-wise. It is also possible to specify each point in the line through a marker.

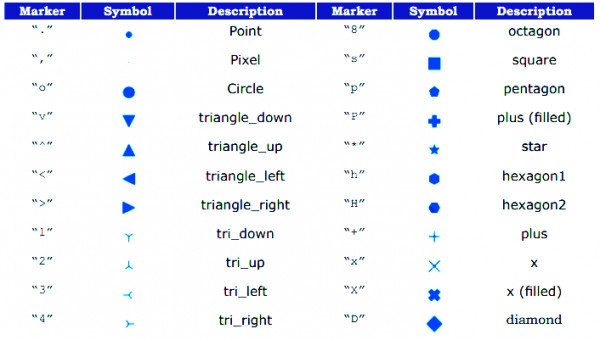
A marker is any symbol that represents a data value in a line chart or a scatter plot. Table shows a list of markers along with their corresponding symbol and description. 

These markers can be used in program codes:

Some of the Matplotlib Markers

Welcome to Sarthaks eConnect: A unique platform where students can interact with teachers/experts/students to get solutions to their queries. Students (upto class 10+2) preparing for All Government Exams, CBSE Board Exam, ICSE Board Exam, State Board Exam, JEE (Mains+Advance) and NEET can ask questions from any subject and get quick answers by subject teachers/ experts/mentors/students.

Categories

...