Use app×
QUIZARD
QUIZARD
JEE MAIN 2026 Crash Course
NEET 2026 Crash Course
CLASS 12 FOUNDATION COURSE
CLASS 10 FOUNDATION COURSE
CLASS 9 FOUNDATION COURSE
CLASS 8 FOUNDATION COURSE
0 votes
97 views
in Computer by (44.9k points)
closed by

Line chart in R.

1 Answer

+1 vote
by (45.2k points)
selected by
 
Best answer

For creating a line chart in R, we use the plot() function.

The basic syntax for creating a line chart is:

plot (v, type, xlab, ylab, main, col)

Description of the parameters used:

v - vector containing the numeric values.

type - takes the value "p" to draw only the points, "l" to draw only the lines and "o" to draw both points and lines.

xlab - label for x axis.

ylab - label for y axis.

main - title of the chart.

col - to give colors to both the points and lines.

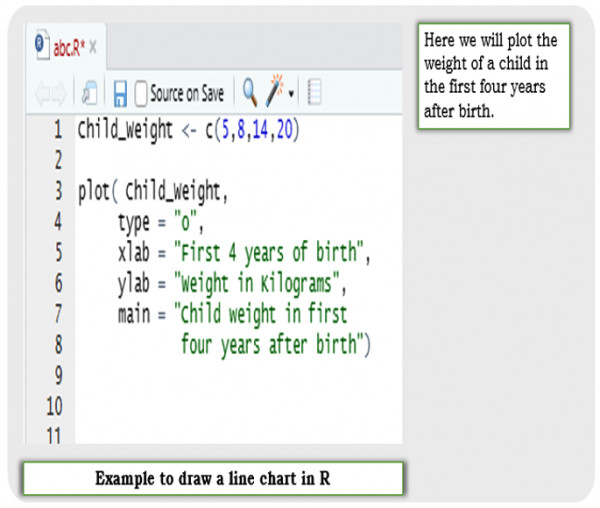
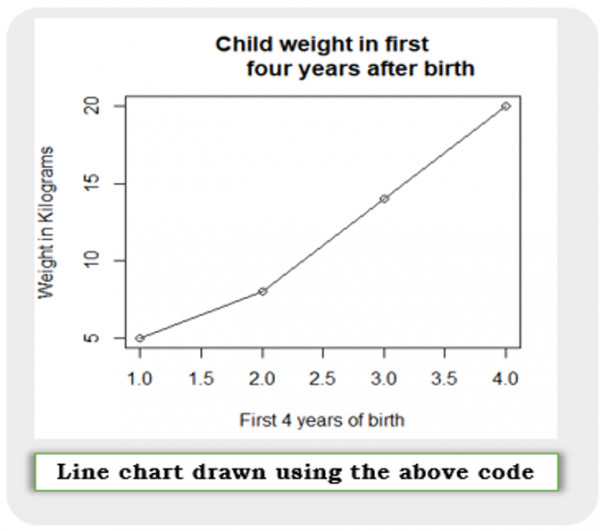
Here we will plot the weight of a child in the first four years after birth.

Line chart in R

Line chart in R

Related questions

0 votes
1 answer
asked Nov 14, 2023 in Computer by AshaUsapkar (44.9k points)
0 votes
1 answer
asked Nov 14, 2023 in Computer by AshaUsapkar (44.9k points)
0 votes
1 answer
0 votes
1 answer
asked Nov 14, 2023 in Computer by AshaUsapkar (44.9k points)
0 votes
1 answer

Welcome to Sarthaks eConnect: A unique platform where students can interact with teachers/experts/students to get solutions to their queries. Students (upto class 10+2) preparing for All Government Exams, CBSE Board Exam, ICSE Board Exam, State Board Exam, JEE (Mains+Advance) and NEET can ask questions from any subject and get quick answers by subject teachers/ experts/mentors/students.

Categories

...