In the following figure, the number of distributors of a company in six successive years has been shown in a line graph overlaid on a bar chart depicting the sales (in millions of rupees). Use this information to answer Questions 1 -2.
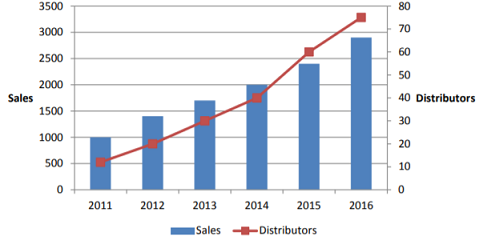
1. In which year were the sales per distributor lowest?
A. 2016
B. 2015
C. 2014
D. 2012.
2. In which year did the sales increase (from the previous year) by a higher percentage than the number of distributors?
A. 2016
B. 2012
C. 2014
D. None.


