n1 = 400, x1 = 25
∴ P1 = \(\frac{x_1}{n_1}\) = \(\frac{25}{400}\) = 0.0625.
n2 = 200 x2 = 15
∴P2 = \(\frac{x_2}{n_2}\) = \(\frac{15}{200}\)= 0.075
H0 : The proportion of defective articles before and after overhauling is the same (i.e H0 : p1 = p2)
H1 : The proportion of defective articles are more before overhauling
(i.e H1 : p1 > p2) { Right upprt Tailed test}
The test statistic is

∴ Zeal = -0.576
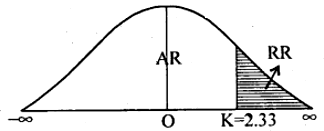
At α = 1 % the upper/right tail critical values K = 2.33
Here Zcal = -0.576 is in acceptance region/ Zcal
∴ H0 is accepted.
Conclusion : The proportion of defective articles before and after .over hauling is same.


