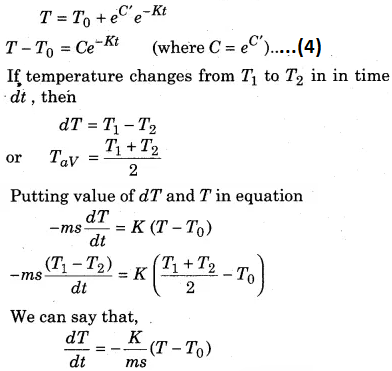
A hot body left to itself slowly cools down to the surrounding’s temperature. It was Newton who found that the rate of cooling depends on the temperature difference between the hot body and the surrounding. Newton’s law of cooling states that, the rate of energy loss by a hot body is directly proportional to the temperature difference of hot body and surrounding (if the temperature difference is small), i.e.,

where ∆Q is the amount of heat lost in ∆t seconds by a hot body. Consider a hot body at temperature T. Let T0 be the temperature of its surroundings. According to Newton’s law of cooling.
Rate of loss of heat ∝ Temperature difference between the body and its surroundings

Where k is a proportionality constant depending upon the area and nature of the surface of the body. Let m be the mass and s the specific heat of the body at temperature T. If the temperature of the body falls by small amount dT in time dt, then the amount of heat lost is
dQ = msdT …(2)
∴ Rate of loss of heat is given by


Using equation (4) we can calculate the time of cooling of a body through a particular range of temperatures.
If we plot a graph by taking different values of temperature difference ∆T = T – T0 along y-axis and the corresponding values of t along x-axis, we get a curve of the form shown in figure (a). It clearly shows that the rate of cooling is higher initially and then decreases as the temperature of the body falls.
Moreover the equation is of the form y = mx + c. So, if we plot a graph by taking log (T – T0) along y-axis and time t along x-axis, we must get a straight line, as shown in figure (b). It has a negative slope equal to -K and intercept on y-axis equal to c.

Experimental Verification of Newton’s Law of Cooling: The experimental set-up used for verifying Newton’s law of cooling is shown in figure. The set-up consists of a double walled vessel (V) containing water in between the two walls. A copper calorimeter (C) containing hot water is placed inside the double walled vessel. Two thermometers through the corks are used to note the temperatures T of hot water in calorimeter and T0 of water in between the double walls respectively.

Temperature of hot water in the calorimeter is noted after fixed intervals of time, say after everyone minute of stirring the water gently with a stirrer. Continue noting its temperature about 5°C above that of surroundings. Plot a graph between loge(T – T0) and – time (t) shown in a figure.
The nature of the graph is observed to be a straight line, having a negative slope. This verifies Newton’s law of cooling.