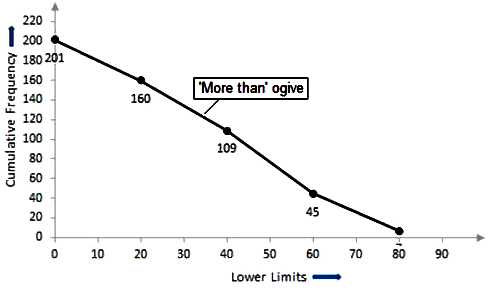
Now, taking lower class limits on x-axis and their respective frequencies on y-axis we can draw its ogive as follows:
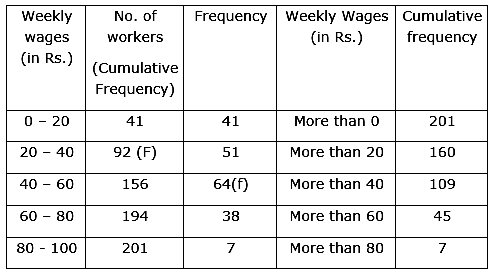
Now, we have n = 201

The cumulative Frequency just greater than n/2 is 156 then the median class is 40 – 60 such that the lower limit (l) = 40
cumulative frequency of the class preceding 40 - 60 (cf) = 92
frequency of the median class 40-60 = 64,
class size (h) = 20
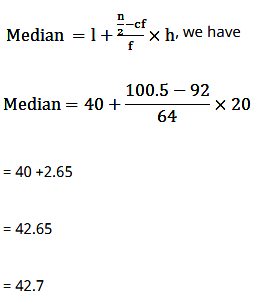
Using the formula,